Table of contents
For adults, the official normal resting heart rate range is 60 to 100 beats per minute. But if you care about optimal health and longevity, the more meaningful target for many healthy adults is often narrower, roughly 55 to 85 beats per minute.
That gap matters more than is commonly understood. Many people hear “normal” and assume “ideal,” but those are not the same thing. A resting heart rate near the upper edge of the clinical range may still count as normal, while also signaling that your cardiovascular system is under more strain than it needs to be.
Think of resting heart rate as your body's idle speed. When you're calm, awake, and inactive, your heart reveals how hard it has to work just to keep the lights on. A lower number, in the right context, often means the system is efficient. A higher number can reflect lower fitness, higher stress, poor sleep, dehydration, illness, or other issues that deserve attention.
That's why this metric is so useful. You don't need a complex scan to start learning from it. You need context, a baseline, and a habit of tracking the trend instead of obsessing over a single reading.
Your Heart Rate Is Telling a Story Are You Listening
A resting heart rate can look “normal” on paper and still give you an early warning about how hard your body is working every day.
The number matters less as a one-time verdict and more as a trend. Your heart works like an engine at idle. If it has to run faster than expected while you are awake, calm, and inactive, that can reflect lower fitness, higher stress, poor recovery, dehydration, illness, or the effects of medication. If it runs more efficiently at rest, that often points to better conditioning and stronger cardiovascular reserve.
That is why the broad clinical range can be misleading when people use it as a finish line. A number inside the standard adult range may just mean there is no immediate red flag. It does not automatically mean the number is favorable for long-term cardiovascular health or healthy aging.
The more useful question is personal: what is your usual baseline, and is it drifting up, down, or staying stable over time?
Two adults can both land in the same “normal” zone and have very different health pictures. One may be well-trained, sleeping well, and recovering well. The other may be under chronic stress, less fit, and trending toward higher cardiometabolic risk. The pulse alone is not the whole story, but it is often one of the earliest clues that the story is changing.
That is why resting heart rate deserves ongoing tracking rather than occasional checking. A single reading is like one frame from a movie. A pattern over weeks and months shows whether your system is adapting well or asking for attention. If you want a simple consumer reference point alongside your own tracking, this normal resting heart rate guide offers a practical overview.
A motivated patient should not stop at, “Is this number allowed?” A better question is, “What does this number say about my current health, and where is it heading?”
Defining the Normal Resting Heart Rate Range
A resting heart rate is your cardiovascular system at idle. It shows how many times your heart beats in one minute when you are awake, calm, and not moving around. That matters because an engine that idles smoothly usually has more reserve than one that has to rev high just to stay on.
For adults, the broad clinical reference range is 60 to 100 beats per minute. For children, normal is higher and changes with age, so the same number can mean very different things in a newborn, a teenager, and a 50-year-old.
Here is the key distinction many people miss. Clinically normal does not always mean optimal for long-term health. The 60 to 100 bpm range is useful for screening and medical triage. It sets outer boundaries. It does not tell you whether your body is operating with the kind of efficiency and recovery capacity linked with better cardiovascular fitness and healthy aging.
That is why resting heart rate works best as a signal, not a label.
Here's a simple age-based reference:
Age Group | Normal RHR (bpm) |
|---|---|
Newborns | Higher than adults |
Age 13 and older | 60–100 |
If you want a more consumer-friendly breakdown of how people use these benchmarks in practice, this normal resting heart rate guide is a helpful companion resource.
What “resting” means
Often, readings get muddled. A pulse taken after coffee, after walking up stairs, during stress, or while scrolling through upsetting emails is not your true resting baseline. It is more like checking a car's idle speed while your foot is still on the gas.
A useful resting measurement means:
Awake and settled: not asleep, but mentally calm
Still: sitting or lying down, without recent activity
Low stimulation: no recent exercise, caffeine, nicotine, or acute stress
Consistency matters more than perfection. If you check under similar conditions each morning, you start to see your real baseline instead of random noise. That pattern becomes even more useful when paired with related recovery markers such as heart rate recovery after exercise, which helps show how well your cardiovascular system responds to effort and then settles back down.
Where the clinical range helps and where it falls short
The standard range gives clinicians a shared reference point. Persistently high or unusually low readings can prompt a closer look, especially if symptoms are present.
But a single reading inside the adult range should not end the conversation. Someone at 62 bpm and someone at 92 bpm are both "normal" by the textbook definition, yet their fitness, stress load, sleep quality, metabolic health, and long-term trajectory may be very different. That narrower question, where your number sits, how stable it is, and where it is trending, is the part that matters for longevity-focused tracking.
Why Your Personal RHR Varies from the Standard
Your resting heart rate is personal. The textbook range gives a wide reference point, but your day-to-day number is shaped by how your body is built, how well it is recovered, and what demands it is handling right now.
A helpful comparison is a car engine at idle. Two engines can both be working normally, yet one idles lower and smoother because it is tuned efficiently, while the other runs faster because it is under more strain or less well conditioned. Your heart works in a similar way. The rate you see at rest reflects how much work each beat has to do and how strongly your nervous system is pressing on the accelerator.
Fitness changes the picture
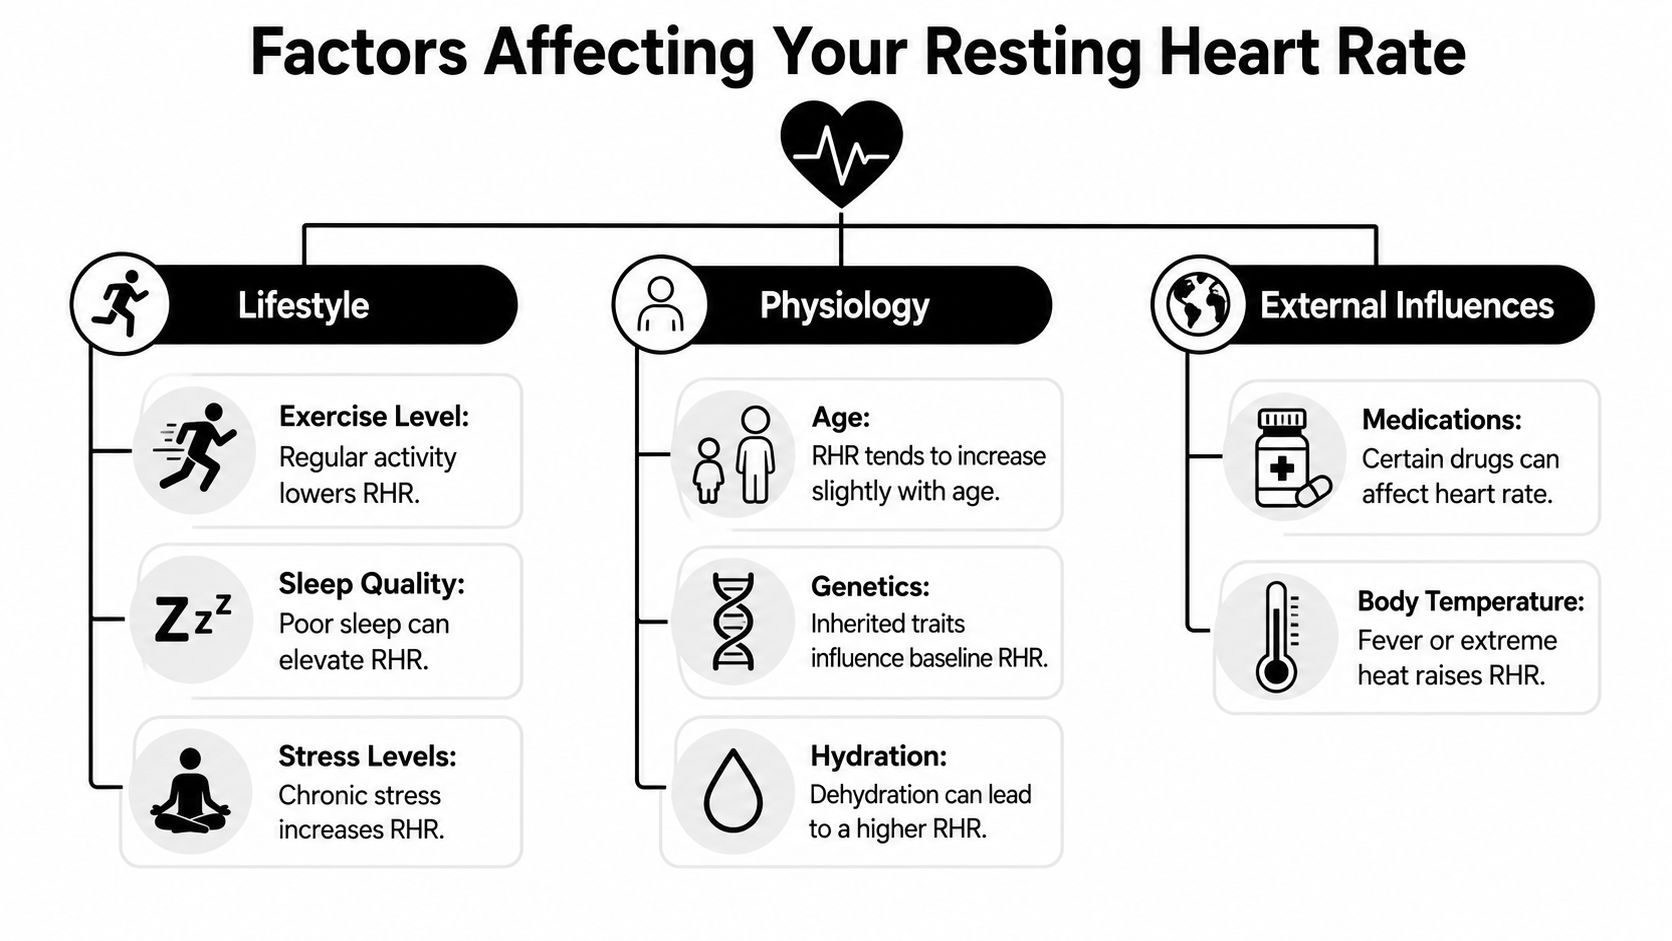
Aerobic fitness is one of the clearest reasons one healthy person has a lower resting heart rate than another.
With regular endurance training, the heart often pumps more blood with each beat. Doctors call that stroke volume. You do not need to memorize the term. The practical point is simple. If each beat moves more blood, the heart does not have to beat as often while you are resting.
That is why a resting heart rate in the 40s can be normal for a trained endurance athlete. In a sedentary adult with fatigue, dizziness, or fainting, the same number deserves a different interpretation. The number matters. Context matters more.
Daily life can shift your baseline
Even in the same person, resting heart rate moves around.
Stress can push it up by keeping the body in a more activated state. Poor sleep can do the same. Dehydration reduces circulating volume, so the heart may beat faster to keep blood moving. Heat, fever, and infection commonly raise pulse because the body is working harder. Some medications slow the heart, while others raise it.
This is why one spot check has limits. A single morning reading may reflect a bad night, a brewing illness, or yesterday's hard workout. A pattern over several days tells you much more about recovery, conditioning, and whether your system is settling or struggling. That pattern becomes even more useful when paired with heart rate recovery after exercise, which shows how quickly your cardiovascular system shifts from effort back toward baseline.
Your baseline is more useful than someone else's average
Two adults can both fall inside the clinical range and still have very different health pictures. One may sit in the low 60s for years, sleep well, exercise regularly, and recover quickly. Another may usually run in the high 80s, feel stressed, sleep poorly, and see the number climb during busy periods.
That distinction matters because "normal" is broad. Your own baseline is narrower. It is the range your body returns to when sleep, training, stress, and recovery are all in a good place.
A few questions make this number more useful:
What does my resting heart rate usually look like when I feel well and recovered?
What consistently pushes it higher or lower for me?
Is my baseline improving, holding steady, or drifting in the wrong direction over time?
Those answers turn resting heart rate from a checkbox into a living signal of health. For longevity, that is the key value. Not whether you can point to one "normal" reading, but whether your trend reflects a heart and nervous system that are becoming more efficient over time.
Interpreting Your RHR for Optimal Longevity
Interpreting the resting heart rate normal range reveals complexity. The broad clinical range for adults is one thing. The optimal range for long-term health is another.
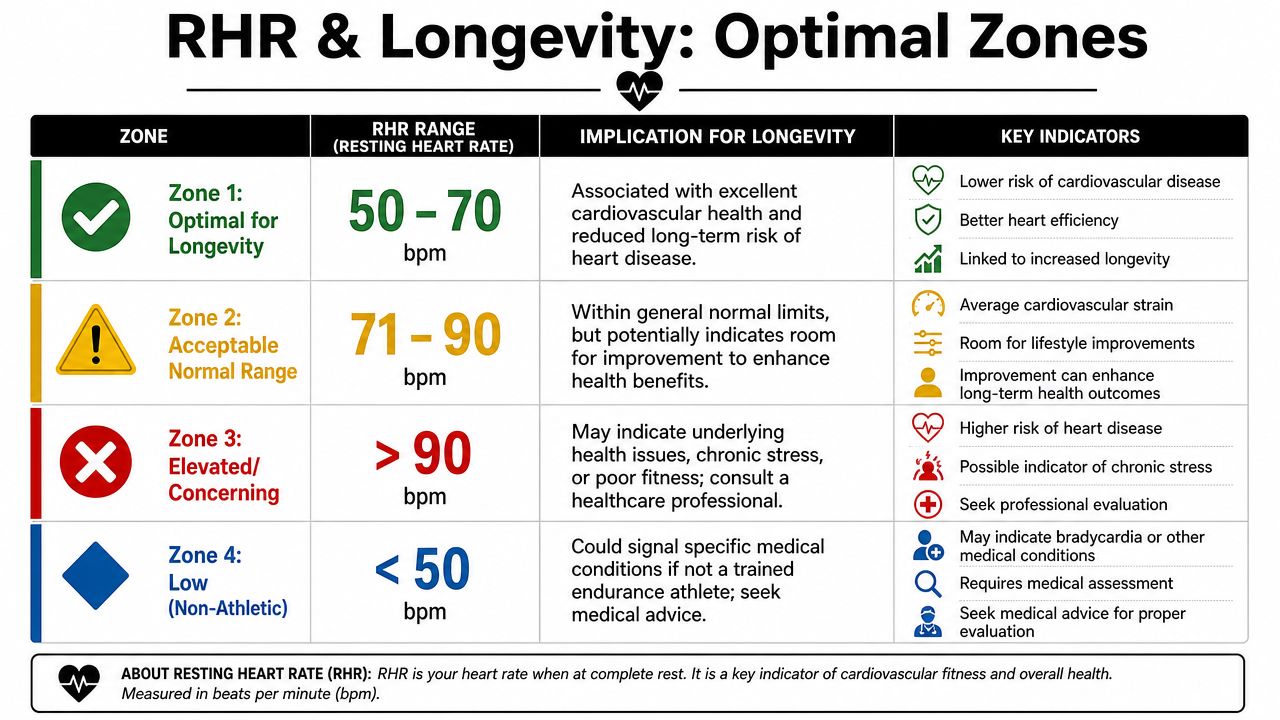
Data from the Health eHeart study found that the optimal range for most healthy adults is 55 to 85 bpm, and people with resting heart rates consistently above 90 bpm showed significantly higher all-cause and cardiovascular mortality according to the study report in PubMed Central.
That finding changes how you should read your number. A resting heart rate of 92 may not trigger panic in the way 120 would, but it also isn't a number to shrug off because it falls close to the official range.
Normal is not the same as optimal
Here's the easiest way to think about it.
Interpretation | Resting heart rate range |
|---|---|
Clinical normal for adults | 60–100 bpm |
More optimal range for many healthy adults | 55–85 bpm |
Needs medical awareness even if near normal boundary | Above 90 bpm |
The mistake is treating the official upper limit as a wellness target. It isn't. It's more like the line where clinicians become increasingly concerned.
Why higher resting rates matter
A persistently higher resting heart rate can reflect several underlying themes:
Lower cardiovascular efficiency
Higher sympathetic nervous system activation
Poorer recovery
Possible metabolic or chronic disease risk
None of that means a single high reading predicts your future. It means your resting pulse can act like an early warning light on the dashboard.
This is also where pairing metrics becomes useful. Resting heart rate tells you about baseline demand. Other signals, such as heart rate variability, can help you understand how your autonomic nervous system is balancing stress and recovery.
A better question to ask
Instead of asking whether your number is “allowed,” ask whether it fits the life you're trying to build.
If you want better energy, better fitness, and lower long-term risk, then your target shouldn't just be avoiding tachycardia. It should be nudging your physiology toward a more efficient baseline through training, sleep, recovery, and stress management.
That's a much more useful frame than chasing a single perfect number.
How to Measure and Track Your RHR Accurately
You can measure resting heart rate the old-fashioned way. Put two fingers on your wrist or neck, count the beats, and estimate your pulse. That's fine for a quick check.
But if you want a useful health signal, wearable tracking is usually better because it captures repeated measurements under real-world conditions.

Manual checks versus wearable trends
A manual pulse check can tell you your heart rate right now. It can't easily show whether your baseline has been creeping up over the last two weeks.
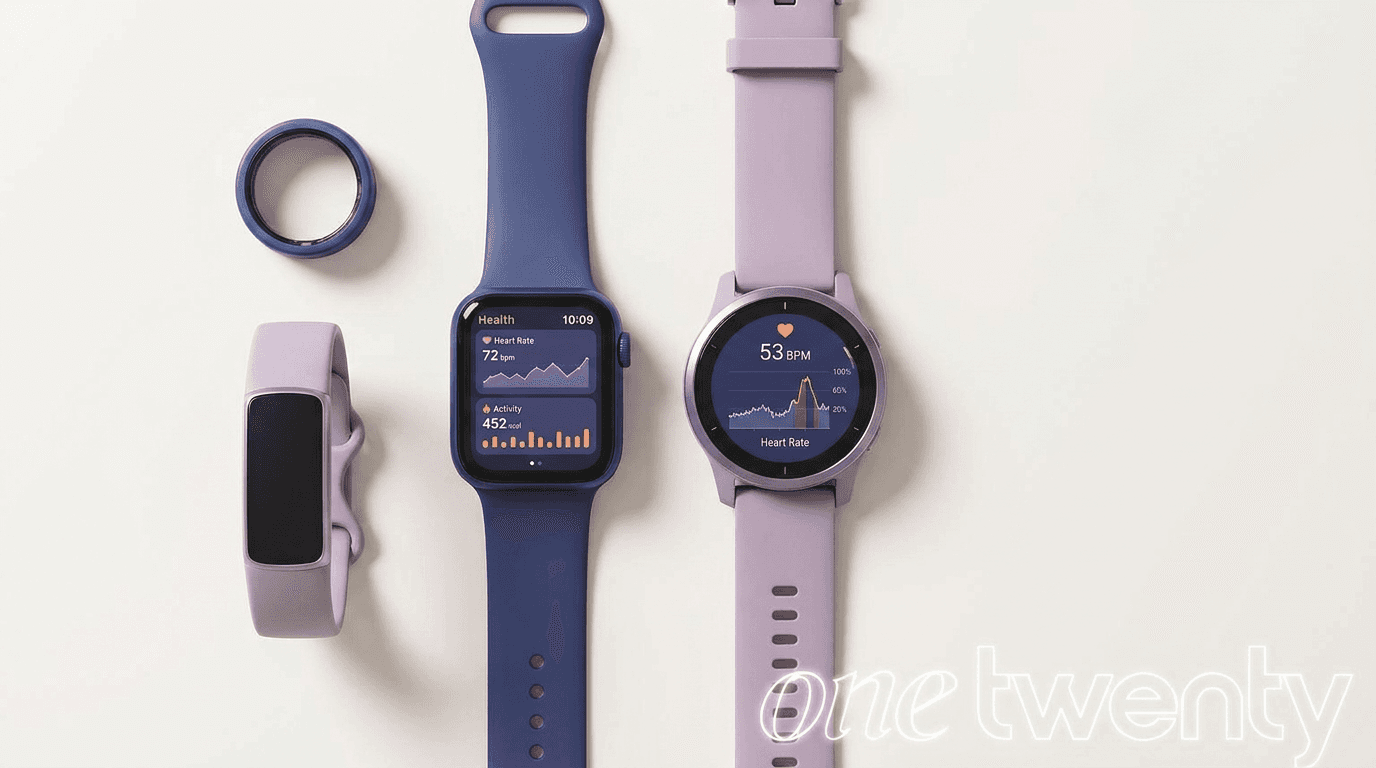
Wearables from Oura, WHOOP, Apple Watch, and Garmin are useful because they capture repeated overnight and daily measurements. That gives you trendlines, not snapshots.
Here's the practical difference:
Manual reading: Good for spot checks, symptom checks, or learning the basics.
Wearable data: Better for tracking baseline shifts, recovery patterns, and the effects of lifestyle changes.
If you're comparing devices, this guide to the best wearable for longevity is a useful place to start.
How to get a clean reading
If you measure manually, the best reading is usually taken when you're calm and consistent with timing. First thing in the morning is often the cleanest window because your body hasn't yet been influenced by caffeine, movement, or work stress.
A few practical rules help:
Use the same timing: Morning readings are easiest to compare.
Stay still: Sit or lie calmly before checking.
Avoid obvious distortions: Don't treat a post-workout number as resting heart rate.
Track the pattern: Write it down or use an app so you can notice changes.
This short walkthrough is also helpful if you want to see pulse checking and heart rate basics in action.
What to look for over time
Don't get trapped by daily noise. Focus on direction.
You're looking for questions like these:
Is my baseline stable?
Does it rise when I'm stressed, sick, or under-slept?
Does it fall when I'm training consistently and recovering well?
That's where the true value sits. A resting heart rate becomes much more actionable when you treat it as a trend line connected to behavior.
Actionable Steps to Optimize Your Resting Heart Rate
Your resting heart rate changes when your body changes. That is what makes it useful.
A lower number is not a trophy by itself, and the broad clinical range is not the same as the range linked with better long-term health. The objective is to help your heart work like a strong engine at idle: calm, efficient, and able to handle demand without racing. For many people, the path there is surprisingly practical. Better aerobic fitness, better recovery, and less chronic strain usually matter more than chasing hacks.
The biggest levers
Start with the habits that change how hard your heart has to work every day.
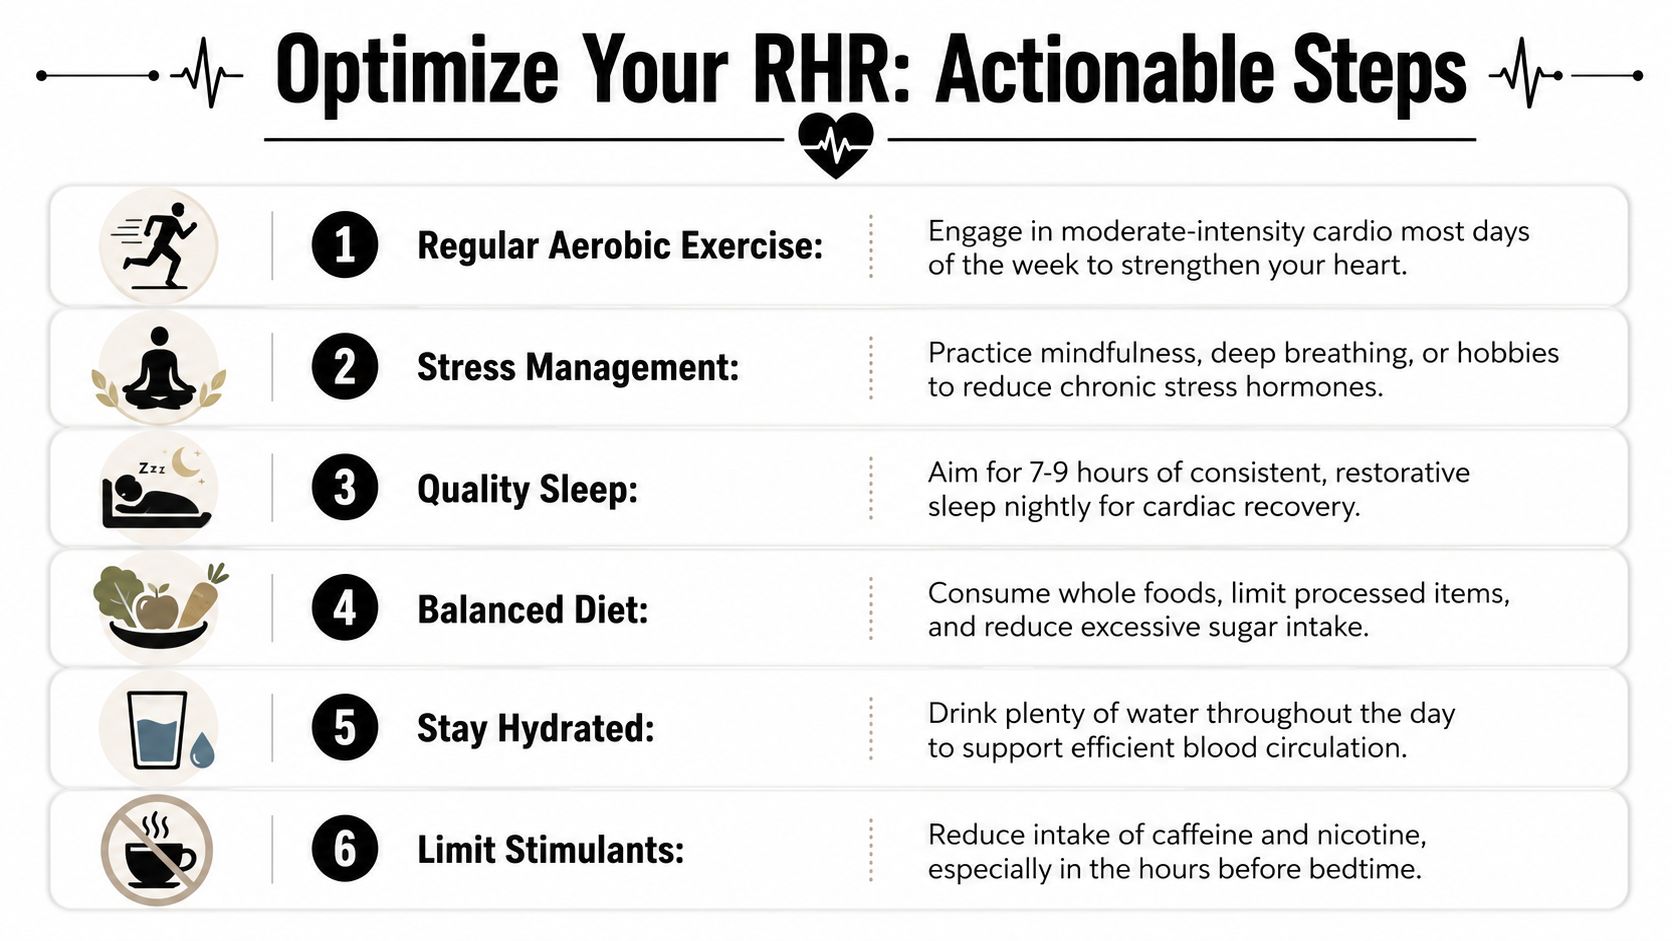
Build aerobic fitness: Regular cardio helps the heart pump more blood with each beat, so it does not need to beat as often at rest. If you want a practical framework, this overview of zone 2 training heart rate shows how to turn that idea into training you can follow.
Lower chronic stress: Ongoing stress keeps your nervous system in a more activated state, which can keep resting heart rate higher than it needs to be. Slow breathing, walking, meditation, and realistic work boundaries can all help.
Protect sleep: Sleep is recovery time for the heart, brain, and nervous system. One bad night can nudge your pulse up. Repeated bad nights can shift your baseline.
Stay hydrated: Low fluid intake means the cardiovascular system has to work harder to circulate blood.
Limit what pushes the pulse up: Heavy alcohol use, nicotine, excess caffeine, and some medications can all raise resting heart rate.
Small habits that add up
Consistency matters more than intensity.
Train regularly, not randomly. A steady walking routine, cycling plan, or easy run schedule usually improves resting heart rate more reliably than occasional hard workouts.
Use your trend as feedback. If your baseline drifts upward for several days, check the basics first: sleep, stress, alcohol, illness, dehydration, and training load.
Schedule recovery on purpose. Rest days and lighter days are part of conditioning, not a break from it. Your heart adapts during recovery.
Treat sudden jumps as clues. A higher-than-usual reading can be an early sign of infection, overreaching, poor sleep, or emotional strain.
Make the healthy choice easier. A bedtime alarm, a daily walk after lunch, and keeping water visible often do more than an ambitious plan you cannot maintain.
This is why resting heart rate works best as a living signal, not a one-time reading. A number in the normal clinical range can still be telling you that recovery is poor, stress is high, or fitness is slipping.
Know when to ask for medical help
Lifestyle habits can improve resting heart rate, but self-tracking has limits.
Talk with a healthcare professional if:
Your resting heart rate stays above 100 bpm when you are at rest and there is no obvious short-term reason, such as exercise, fever, or acute stress.
Your resting heart rate is below 60 bpm and you are not endurance trained, especially if you feel dizzy, weak, lightheaded, faint, or short of breath.
Your baseline changes sharply and stays changed without a clear explanation.
You notice symptoms with the number, such as chest pain, palpitations, unusual fatigue, or breathlessness.
Those visits are more useful when you bring context. A trend line, symptom notes, sleep changes, and training history give a much clearer picture than one isolated number.
If you want to go beyond isolated readings and see how resting heart rate fits into your bigger longevity picture, OneTwenty helps connect wearable data, biomarker testing, and personalized preventive insights into one view. It's a practical way to track not just whether your number is normal, but whether your biology is moving in the right direction.

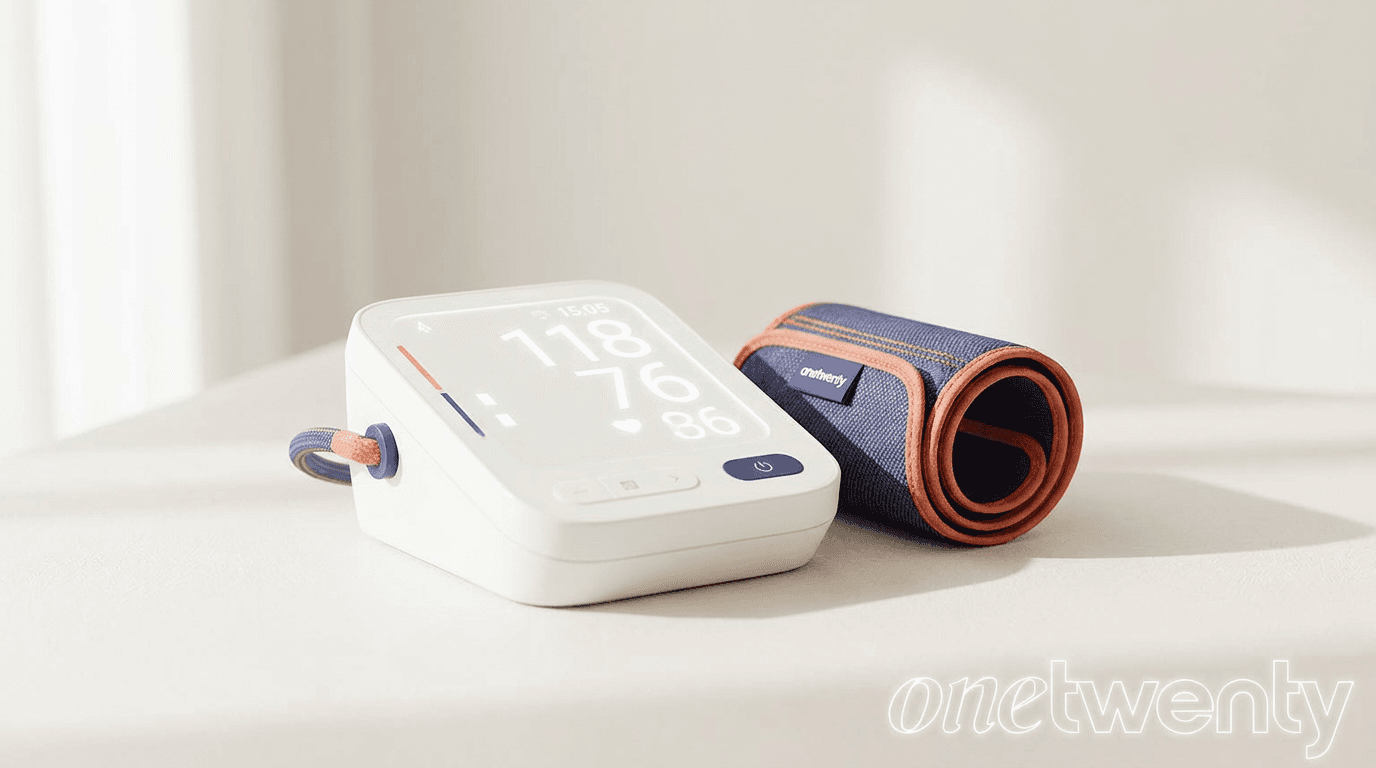
How OneTwenty Works
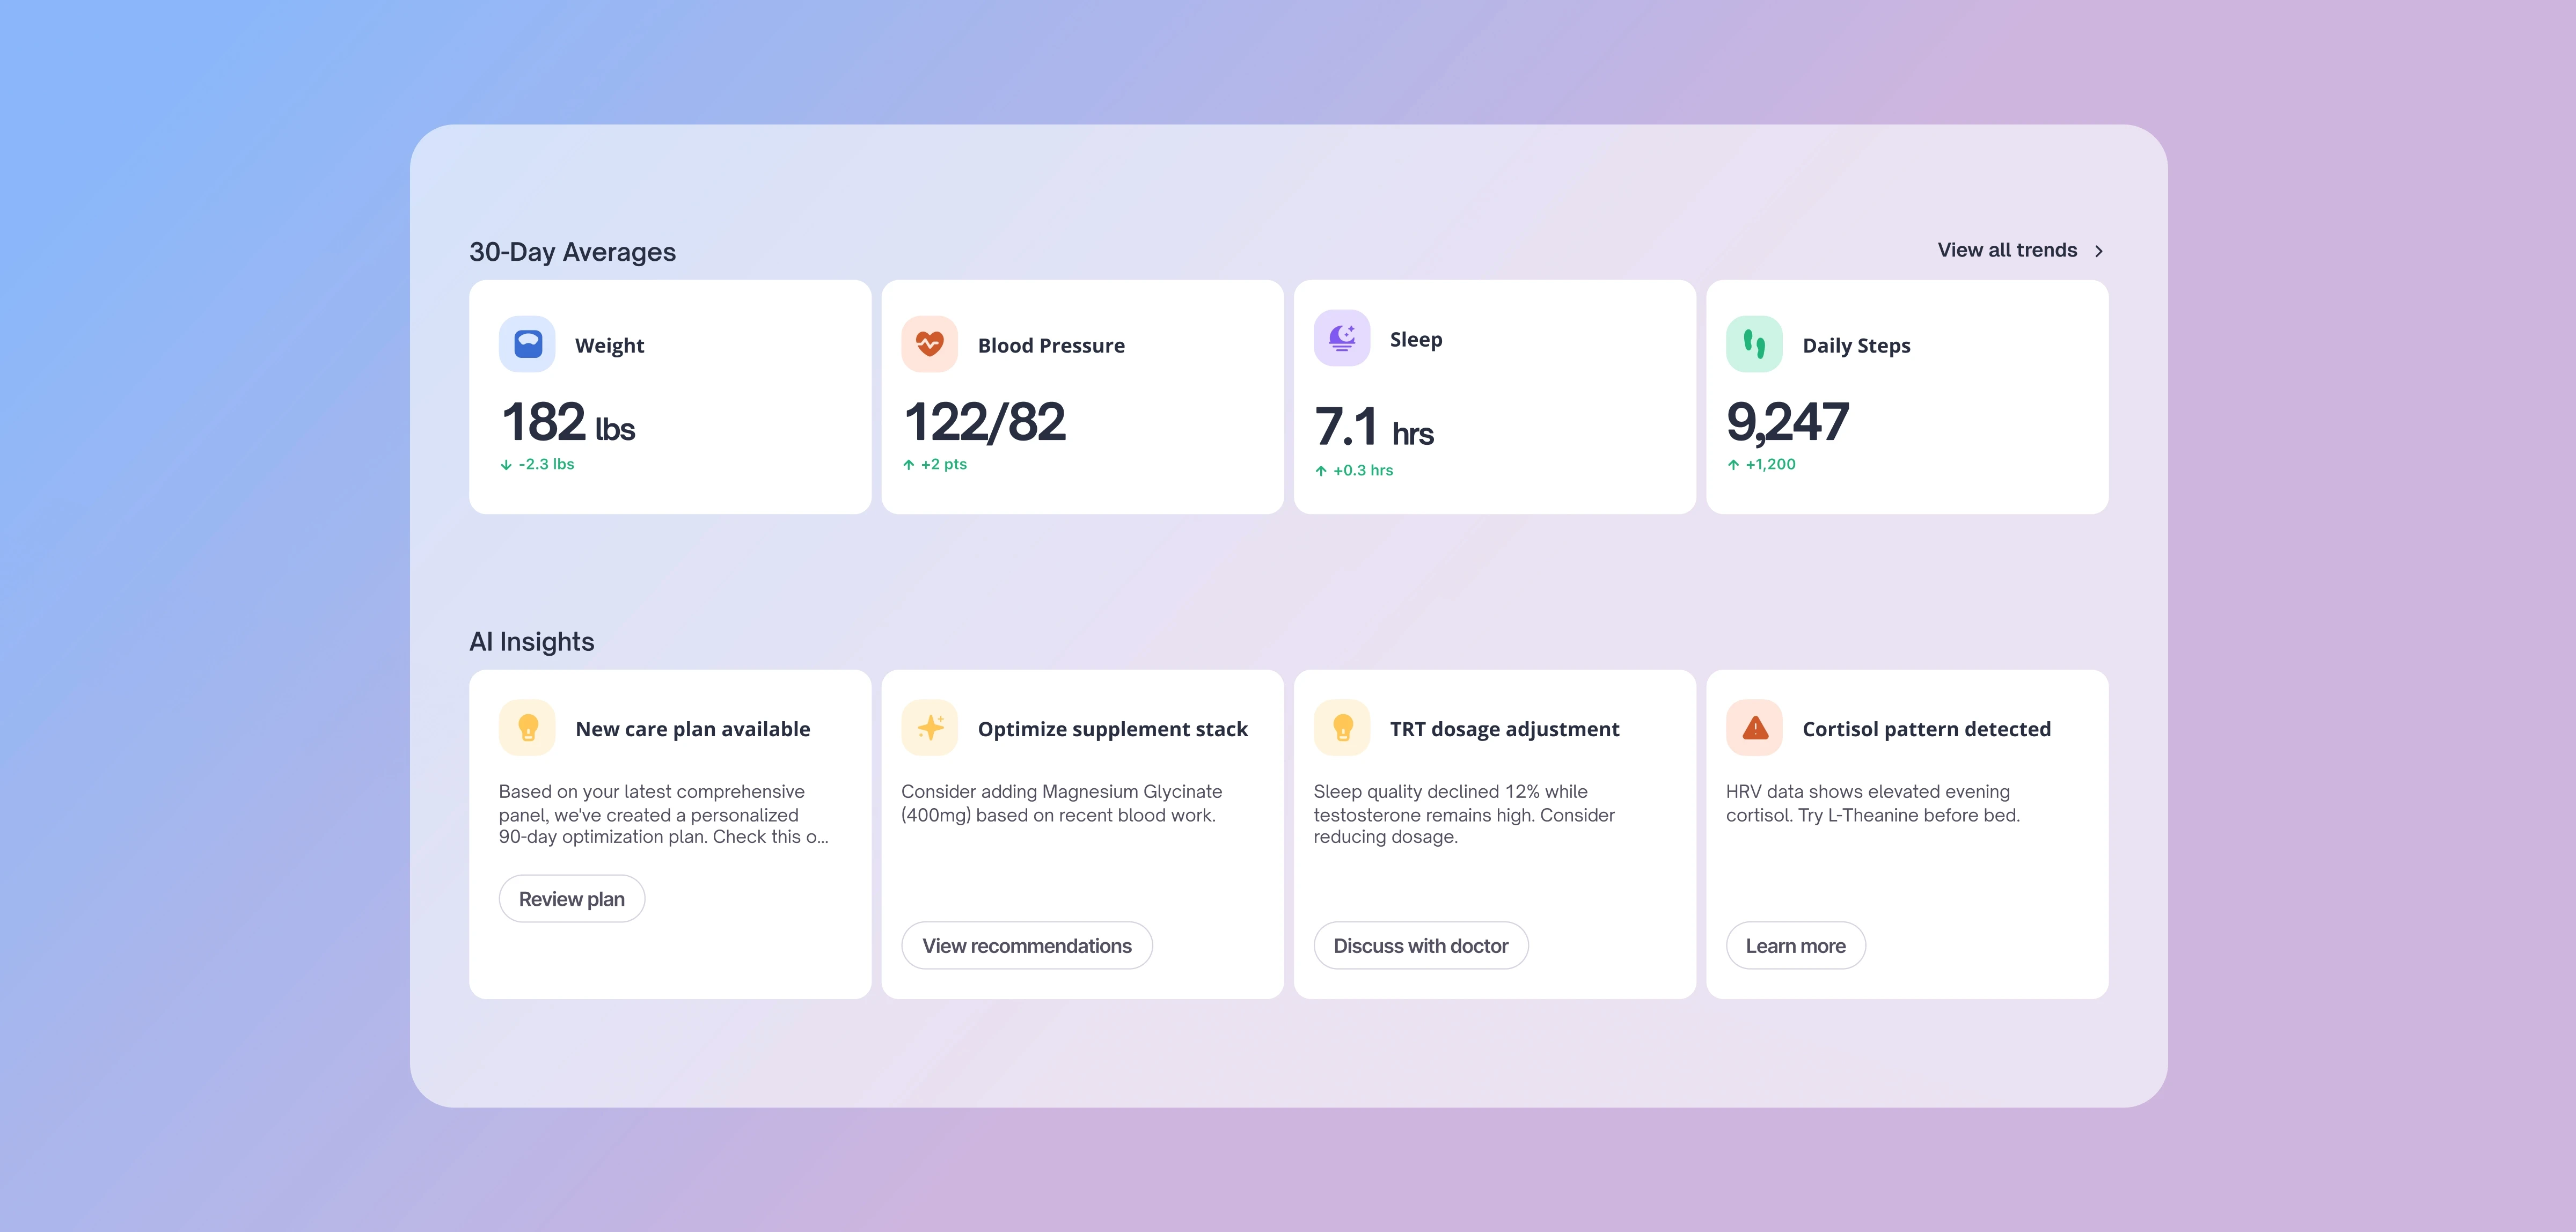
Not your average
Checkup.
Every life stage brings new biological demands. Tracking the right metrics at the right time helps you adapt, optimize performance, and extend both lifespan and healthspan.
Your Annual Physical
Manual Data Processing
Guesswork Trend Detection
Once-a-year physical
Reactive, tested when sick
No data between visits
Once a year testing
Delayed Results
One-size dosing, set and forget
Real-Time Trend Insights
Daily smart-device data
Automated Data Sync
Quarterly Biomarker Tests
Optimal, personalized targets
Plain-language AI insights
Medications titrated to your data
Built to extend healthspan

Frequently Asked Questions
Clarity before
you commit
Answers on setup, scale, and support to remove blockers.